Three weeks in the red.
Broken — or variance?
Upload your backtest. Connect your account. Get a verdict in real time.
Your backtest has already answered that question thousands of times. IronRisk connects your statistical history to your live account in real time — so you know whether what you're seeing is a real warning sign or just expected noise. Before you touch anything.
Your system has survived this before. Your backtest proves it.
Your backtest has the answer. The problem is it's not available when you need it most.
IronRisk puts it in front of you, in real time, every time you doubt.
1. Upload Your Backtest
Upload your Strategy Tester report — CSV, HTML or Excel. Or define your metrics manually in the simulator. We automatically verify which probability distribution fits your data.
2. Define Your Limits
Max Drawdown, daily loss. The thresholds your rational self sets when the market is closed.
3. Auto-connect
Download our auto-installer. It places the firewalls in your MetaTrader and establishes secure telemetry autonomously. You'll be protected in seconds.
See it from the inside
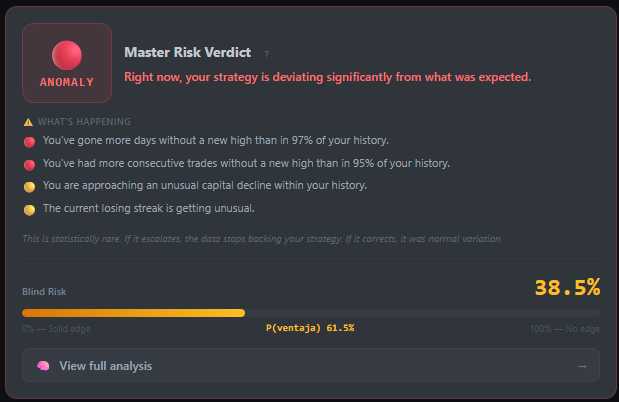
Real-Time Risk Verdict
The Monitor analyzes your live metrics against your backtest and issues an instant verdict: CONSISTENT, DEVIATION, or ANOMALY. Includes your Blind Risk — the Bayesian probability that you're trading without a real edge. No subjective interpretation, pure statistics.
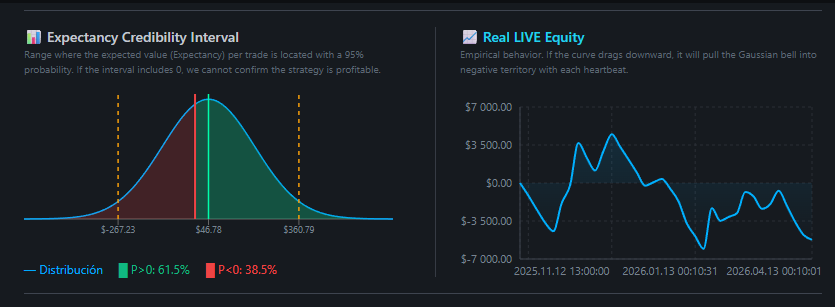
Bayesian Engine
See your expectancy bell curve and your real equity side by side. If the green zone dominates, your trades confirm an edge. If the red grows, your results look more and more like noise. No opinions — just what your own numbers say.
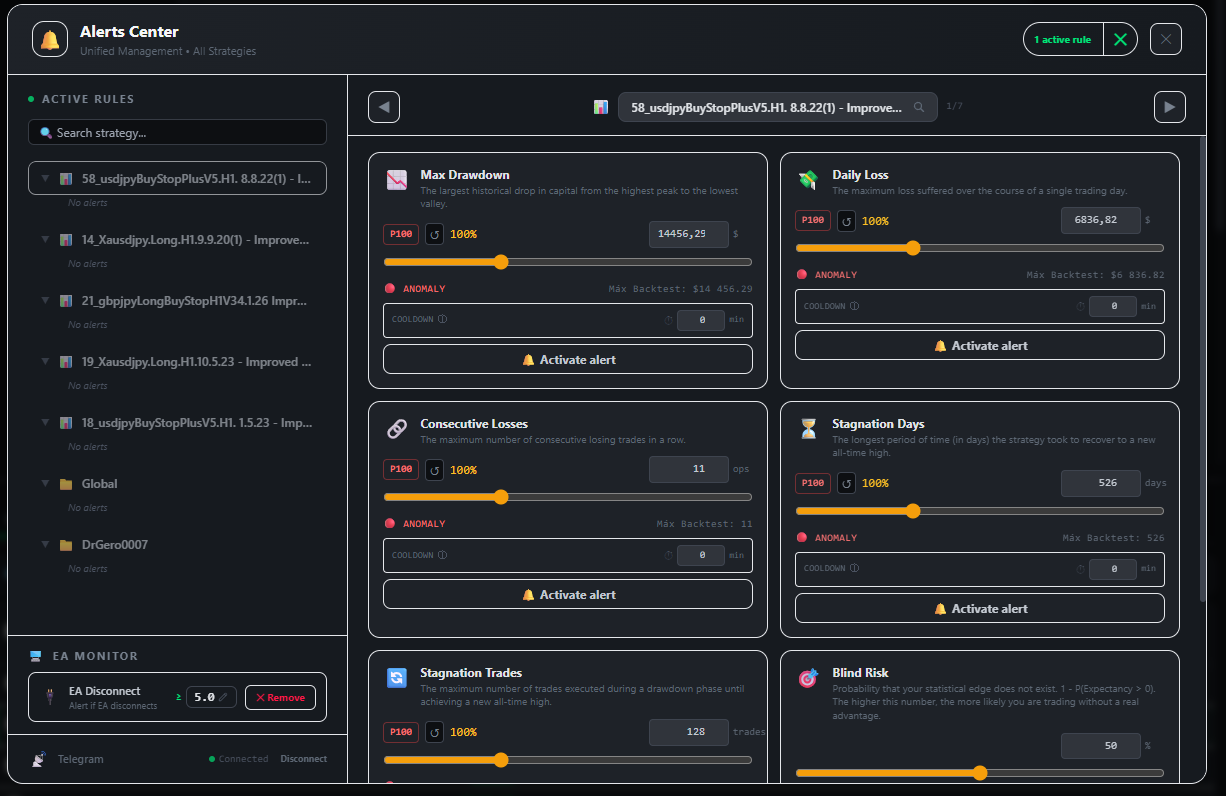
Alerts Center
All alerts from all your strategies, centralized. Every time a metric enters unusual territory, you get a notification with the exact statistical context.
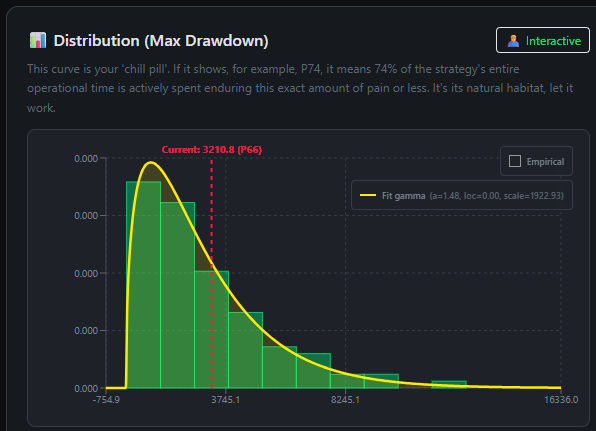
Micro Inspector — Distributions
Click any metric and visualize exactly where you stand on the probability bell curve. Your drawdown stops being a number and becomes a percentile you can interpret.
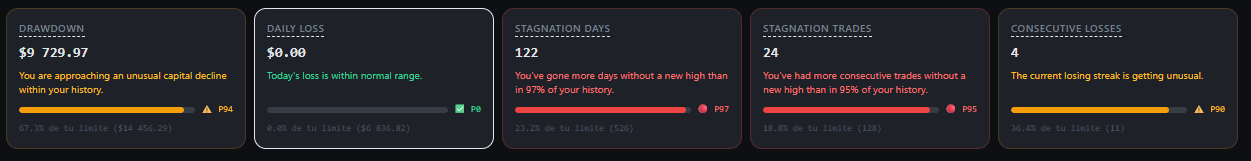
Metrics Panel — Quick Glance
Five risk metrics, five progress bars, five percentiles. At a glance you know if your drawdown, daily loss, stagnation days, and losing streaks are within expected range. No charts needed.
The Ulysses Pact
Set your limits when you're rational, with the market closed. IronRisk applies them when you're staring at a red number with no context. That way the decision is made with your own data, not your gut.
❌ Without IronRisk
- •You see -$800 and panic
- •You close the losing trade prematurely
- •You open revenge trades to "recover"
- •You destroy your system's statistical edge
✓ With IronRisk
- •You see -$800 and IronRisk shows percentile 33 — familiar territory
- •You see your backtest had drawdowns of -$2,400
- •Your brain receives the signal: "my data says this is expected"
- •You let the system work without intervention
Not a Kill-Switch
IronRisk does not lock your screen or force-close your trades. We hate losing control of the account just as much as you do. We give you the statistical context you need to make that call yourself, with data, not with your gut.
The right question already has an answer.
Your backtest already knows whether what you're seeing live is normal or a real signal. IronRisk shows you before you make any decision.
Analyze your strategy for free. Upload your backtest and discover in seconds if your system has a real statistical edge.
IronRisk is an 'indie' tool, built by an independent algo-trader. Pure craftsmanship, no rush, no corporate pressure.
🛠️ Indie tool. No investors. No pressure to monetize your data.